|
Dear all, I have boundaries of a study area and would like to associate them with the SIGRID grid, how do I do this? |
|
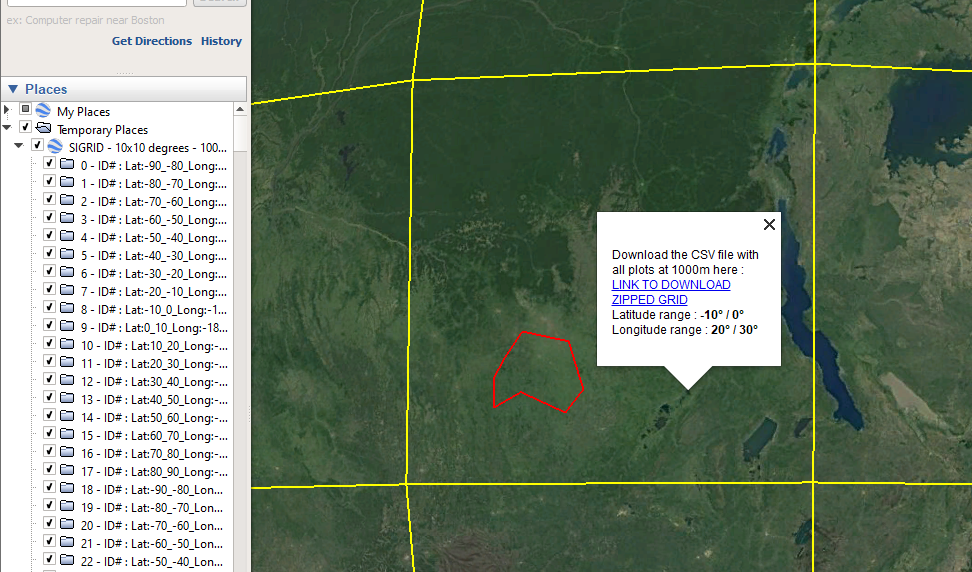
The Systematic Iterative GRID ( SIGRID for short) - https://github.com/herrtunante/SIGRID - is a global grid that contains plots at 1km distance, both in latitude and longitude. The grid guarantees a constant distance at any latitude, a logical ID system, a very easy way to disaggregate plots into different distances (to easily intensify the systematic assessments ) and a reproducible nature (the Java source code can easily be run to generate the same results or grids at other distances ). The SIGRID grid is really large ( the whole database is about 20 GB) so we have a way to download just parts of it. You need to download this KMZ open if in Google Earth, then find your AOI and click on the map. This will show a popup from which you can download the grid for the area. The world has been subdivided into cell of 10 by 10 degrees (if you are unlucky and your AOI covers multiples cells then you have to repeat the process for each one. In our example, the red polygon is our AOI and we need to get the grid for the cell that contains it.
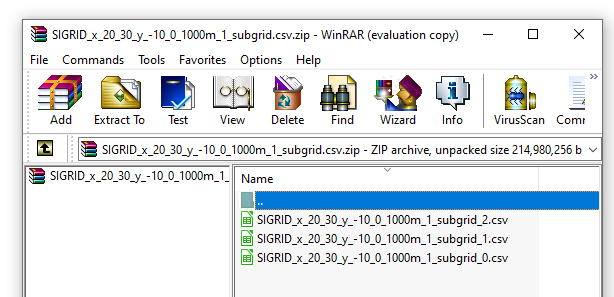
Click on the link of the popup to download the grid at 1x1 km for the 10x10 degree cell. This will download a ZIP file. The contents of the ZIP file is three CSV files that contain the whole grid (the CSVs have been divided into three as Excel/LibreOffice Calc can have issues handling so many lines in a CSV ) . You can access all of the cells here too : LIST OF ALL GRIDS
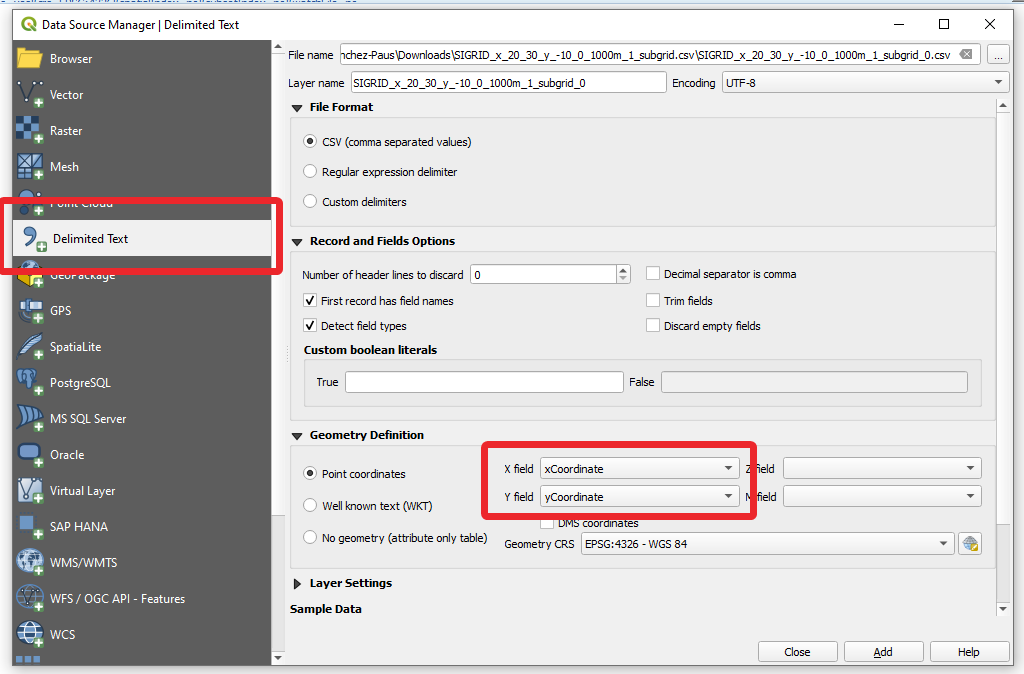
So, now we need a program like QGis to clip the grid to our AOI. In QGis, you will load the CSVs using the Data Source Manager - Delimited Text option.
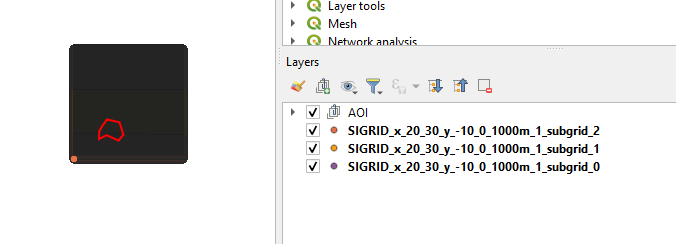
Then you load the AOI (your project polygon) and the three CSVs with the SIGRID plots.
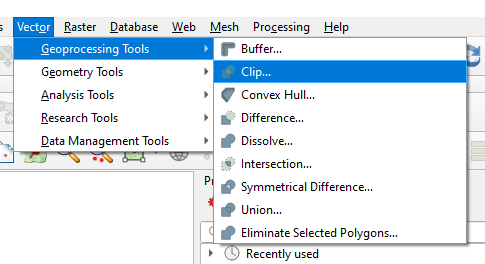
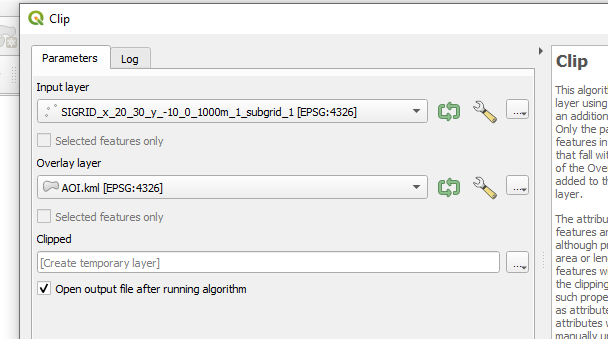
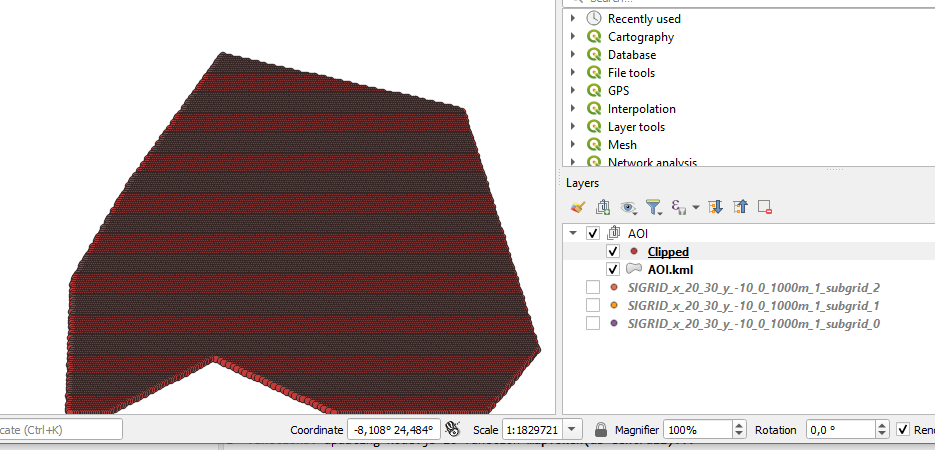
Finally, using the Clip option in QGis you can get the SIGRID plots that intersect your AOI.
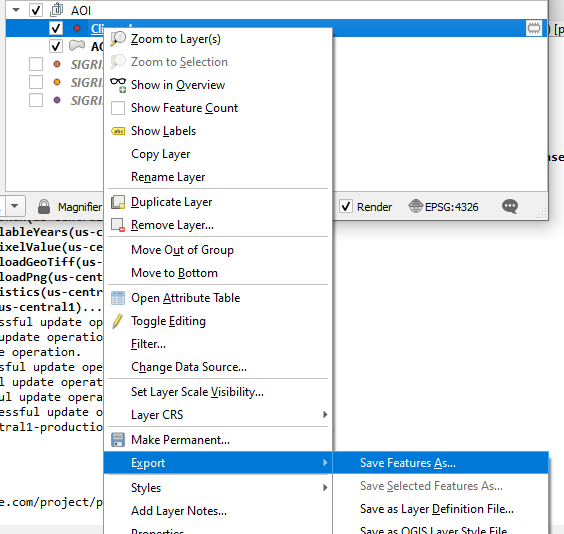
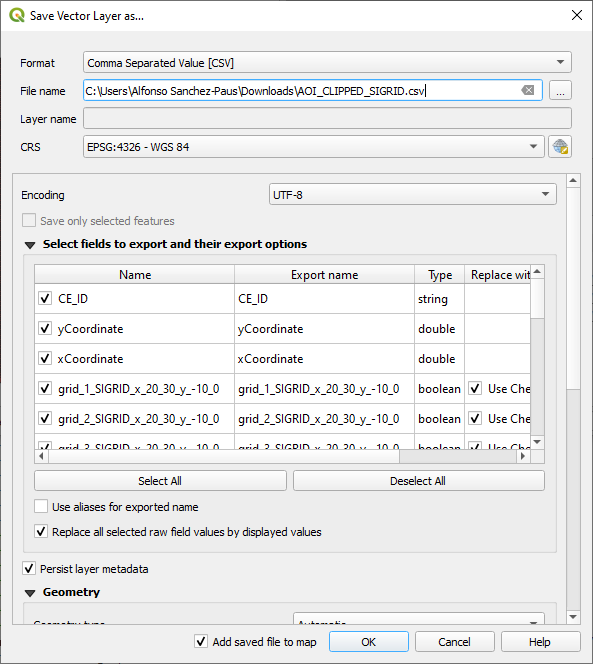
NOW: You have the SIGRID plots for the AOI. Export the clipped plots to a CSV like this :
NEXT STEPSSIGRID plots are at 1x1 km intensity, but you could easily subdivide them into multiple grid intensities like 2x2, 4x4, 8x8 or whatever intensity is necessary in your study.
The contents of the CSV exported previously look like this :
The meaning of the headers in the CSV is to identify to which inentity of grid each plot belongs to. All plots belong to the grid_1 (1x1 km ) grid...next column - grid_2 (2x2km) only one in four lines have this cell set to true. grid_3 (3x3 km) same thing, only one in nine plots have this field set to true. You can use this data to produce the grids at multiple intensities, allowing for easy stratification. Even more useful is that you could start running a CE assessment at a coarse intensity ( i.e 8x8 km) and then after checking the sampling uncertainties of the data collected, decide to intensify the data collection to 4x4 km. As the SIGRID plots define a master sampling frame with consistent IDs the process of intensifying the sampling is much easier than when you produce the grid with a GIS approach (including intensifying the grids generated with the Collect Earth Grid Generator https://collectearth.users.earthengine.app/view/collect-earth-grid-generator. |

