|
Dear OFT, I am preparing a survey, and I would appreciate your responses and advices on the below points, which I need to clarify before I start the implementation of the project with Collect Earth. Just to note, that the sampling design (number, and position/coordinates of the plots) has been defined and fixed:
Thanks a lot, and apologies for this extended long list of questions. Regards, itzam |
|
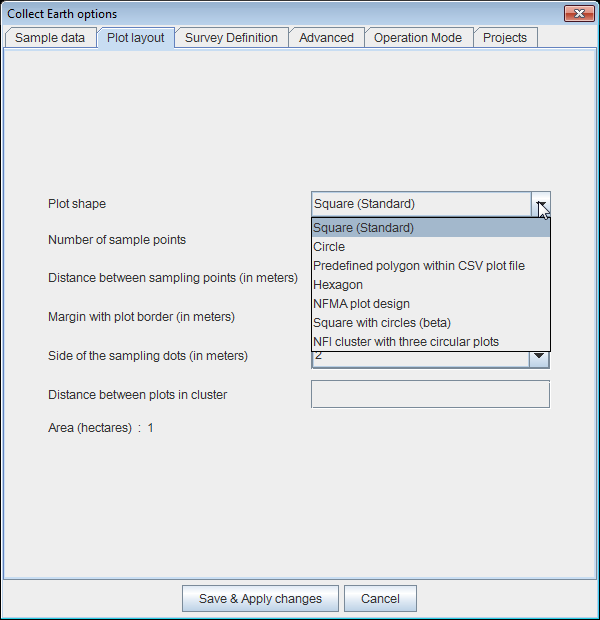
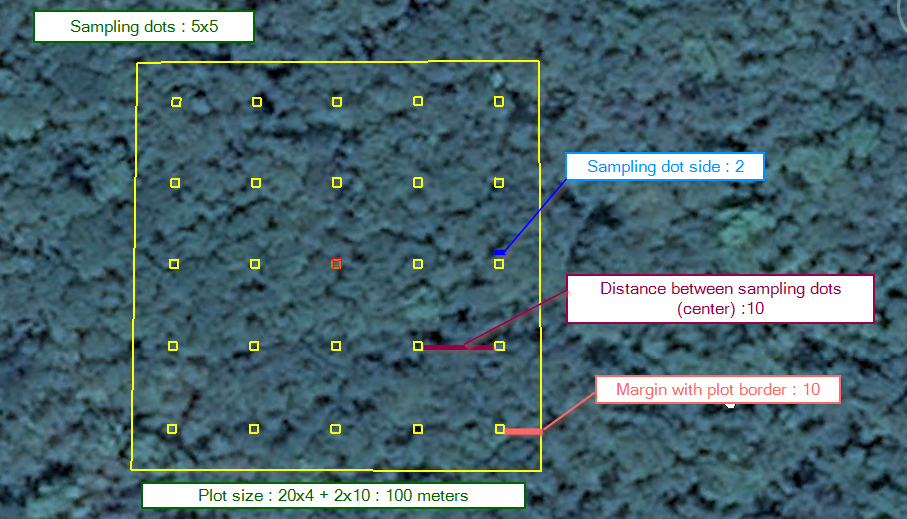
Is there a way to customize the plot size to other than the default given values (e.g. to 1.5 ha)? Yes! You can do it in the Collect Earth Properties Dialog, go to the Plot layout tab: There you can choose the plot shape( square, circle, Hexagon or predefined polygon from external source, among other more obscure ones) the number of sampling dots within the plot, the distance between the sampling dots, the size of the sampling dots and the margin between sampling points and border. When you change the fields you can see how the area of the plot changes. Please try different options, there are no side effect to the changes and they can be easily rolled back.
This is a small visual guide of what the fields represent:
|
|
Hi Itzam, Here comes a long answer to a long question: Is it possible to add further information to the plots after the end of the “interpretation phase” (i.e. the phase where the users fill in the question forms) in order to be able to perform analysis (e.g. Saiku) with all of it at the end? Meaning that the project can be initiated and completed having a CSV file with only the basic columns as specified by the CSV grid template (id, Ycoord, Xcoord, elevation, aspect, slope) and after its completion to add/assign other (e.g. vegetation zones, soil zones, climate zones, etc) spatially available information (info available from a shp per plot) to the plots (based on previous responses this will require the change of schema design with adding the respective attributes and the change of the CSV file with adding respective columns)? Yes, no problem at all. You can always add new attributes to your survey after you finished collecting the data and then import the new data to these new attributes using the functionality to import CSV files ( see Tools->Data Import/Export->Update Current Records Using CSV ). The way this works is that it allows you to add data to plot records that are already on the database. So you cannot add new information to plots that have not been collected yet (of course). Please see this post for further info. Should I need to know in advance (i.e. before the initiation of the project) the information to be added later, at least as a “title”, in order to add in the CSV file the headings for this additional information and in the schema the attributes (and keep the records in the CSV file blanks), or I only need to have a CSV file (with columns) and attributes in the schema design, only for the already available information at the time the project begins (i.e. slope, aspect, elevation, coordinates)? No, you do not need to. In fact we do this very often as many times you will add extra information coming from maps after all the Collect Earth data has been collected, and you would like to use these data through the Saiku analysis tool to combine with the visually interpreted data. The only cumbersome thing is that you will need to add these new columns to the CSV files if you want to review the plots later on, otherwise Collect Earth will not show you the plots as the new "from CSV" attributes are not present on the old CSV files. You can use Saiku (after you import the new data) to generate the new CSV files (following the expected column ordering) as you will have all the necessary data Should the region_areas.csv and/or areas_per_attribute.csv files be contained in the CEP file from the beginning of the project, or can be added later (e.g. at the end), since from what I understand, are being used for the final analysis? Nope, the areas_per_attribute.csv file (region_areas.csv was the old format) is used by Collect Earth when the Saiku database is generated. This means that it is not necessary to have t from the beginning, just at the time of analysis (if one wants to use area information rather than plot counts in the analysis phase) |
|
For the attributes labeled as “coming from CSV”: In the survey design, should I always mark the “only when expression is verified” using the “false()” function and having them as “Not required” and “hide when relevant”? The attributes marked as coming "From CSV" are by default "Not Relevant", meaning that they shall not be shown to the user in the form interface (unless the user chooses to do so by marking the "Include in header" option which will make the attribute name and value shown in the top of the form) What is the purpose of having a code attribute with a code list, since the values of the attributes are coming from the csv (i.e. already spatially available info)? It might be useful if you have really large surveys with loads of data. The Saiku database will be faster when using code lists rather than text attributes. |
|
The sampling design resulted to more than 10,000 plots. I have already a CSV file with information on id (text attribute such as XXX_1, XXX_2), Ycoord , Xcoord, slope, elevation, and aspect, all of them per plot. The users that will be involved are more than five (not in a network). I would like to provide them with a specific amount of plots to work with, each time (e.g. 500 plots) avoiding overlapping: Please use the Collect Earth utility to dive CSV files, it allows you to also radomize them if you want. *Go to Tools->Utilities->Divide large CSV plots* Always, very important to assign CSV files per interpreter and make sure that the interpreters don't work on each other files. |
|
5.Could you advice me on how to proceed with that split of the plots? Am I going to split the CSV file, to a number of CSV files containing e.g. 500 plots each, and providing the users with one of those CSV files each time? Or is there a more efficient and more secure way, in order at the end the incorporation into one to be easier? Am I going to provide the users with a different CEP file, every time the CSV file changes? Just to note that I tried to import my CSV file in the survey from the survey designer (survey tab, in the Grid type) and I got the message “The number of plots (lines) in the CSV file should not be larger than 3997.” |
|
Dear OFT, Thanks a lot for you very quick replies. Regards, itzam |


