|
Hi OF Team, I understand basic statistics are calculated directly in Saiku, using the button labelled with a Sigma. However, using this merely displays min, max, mean, sum and std. dev. Where would you recommend to calculate additional statistics like confidence intervals, SE%, etc.? Does this require an additional R script? Is there any information in the tutorials/manuals on this issue that I have overlooked? Thanks for your help!! Alex |
|
According to my experience with collect and calc, in order to calculate these statistics, it is necessary to incorporate them from R in Calc, where, according to the cube that you want to add information, you can calculate the statistics using RStudio for the data inside the cube and then you can analyze this information in Saiku. Saludos desde Chile. |
|
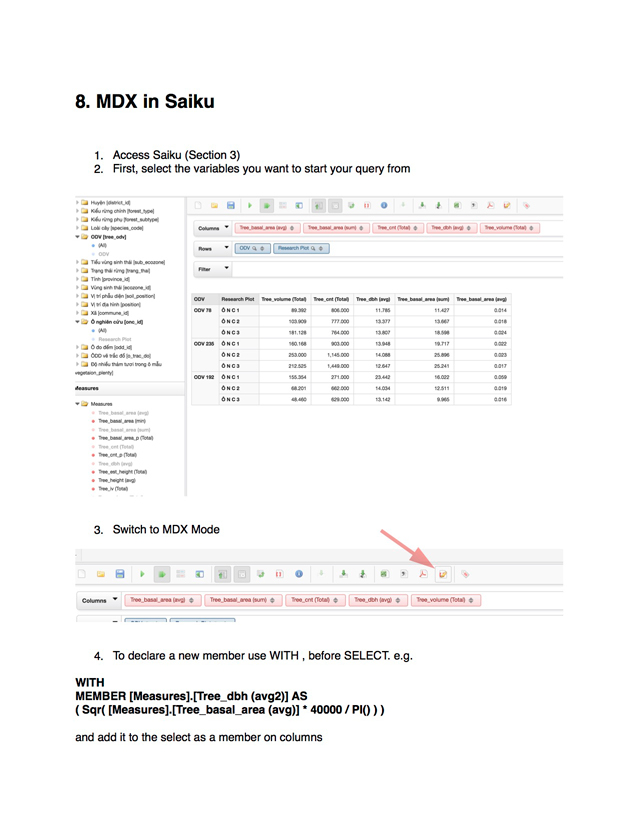
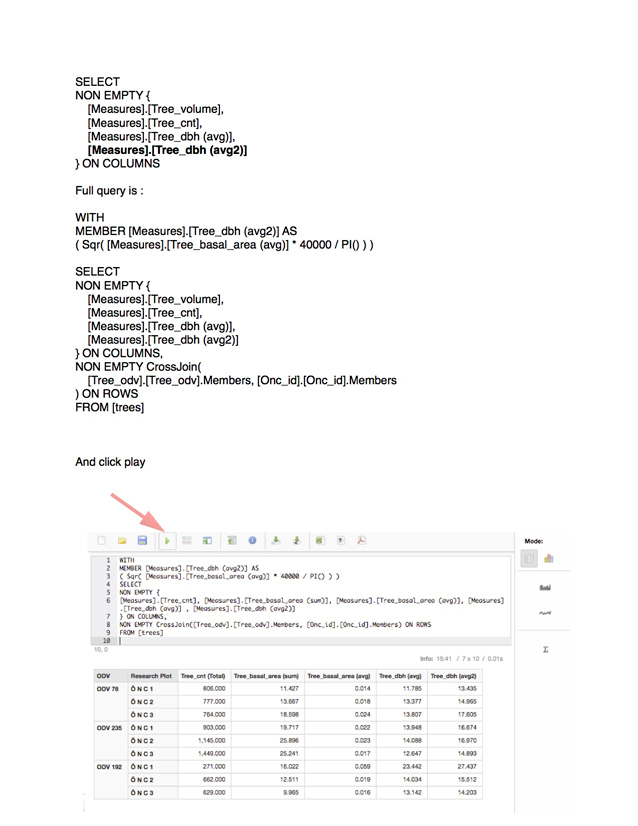
Hi Alex, Francisco, Francisco is correct, but adding calculation in R will allow you to add information to the raw data that will be then aggregated in Saiku. If you instead want to produce results directly to the aggregated data (for example the information you want to aggregate doesn't follow basic aggregation currently available in Saiku) you can use advanced MDX mode. Attached a small example of MDX to calculate results from an aggregated member. Please let me know if this is enough or you need more info. Thank you, Mino
|


