Dear all, I have a systematic grid to use as survey in Collect Earth and I would like to include some administrative information such as Province, District etc. Is there a way to include the adm details in the csv file? Many thanks in advance, Best L

asked 28 Mar '23, 11:32

nephentes7's gravatar image

nephentes7
112
accept rate: 0%

edited 28 Mar '23, 14:31

Open%20Foris's gravatar image

Open Foris ♦♦
9995714


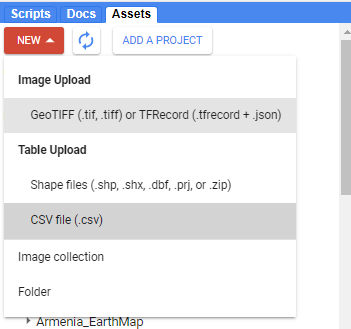
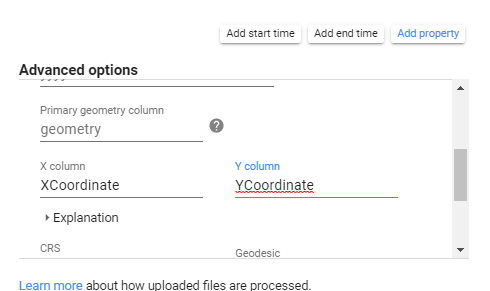
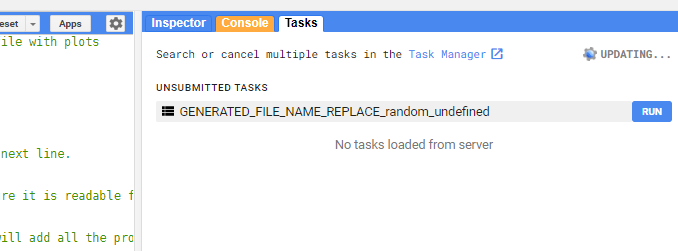
While you could do this in QGis by downloading the GAUL rasters (or for instance the shapefiles available at GADM https://gadm.org/download_country.html ) using the spatial-join operation with the points in the CSV file, the simplest solution we have right now is to use a ready-made GEE script that fetches that information automatically from Google Earth Engine assets.

The script allows you to add data on country/province/district from the GAUL 2014, to also add data on Climate/Soil/Ecologic Zone (which can later be used by Collect Earth to generate the IPCC GHG Inventory activity-data), SRTM DEM derived elevation/slope/aspect and to even add data from other rasters that you might already have for the region (i.e. you have a previously made Land Cover map and you want to know what was the land cover classification at the location of a plot.

You need to have a GEE developer account to use this method : https://signup.earthengine.google.com

  1. Upload the CSV file to GEE as an asset. Make sure that when you upload the file you set the name of the headers of the columns that contain your latitude and longitude. If you are using a CSV that jad been used in Collect Earth the columns will be called YCoordinate and XCoordinate.

alt text

alt text

  1. Once the asset has been generated, copy the asset ID, should be something like : users/YOUR_USERNAME/ASSET_UPLOADED

  2. Open this URL : https://code.earthengine.google.com/?scriptPath=users%2Fsanchezpaus%2Futils%3Agrid%2FaddDataToCsv_SUPPORT_FORUM

  3. Paste the ID of the asset on the line 28 so it becomes :

    var plotsAsset = "users/YOUR_USERNAME/ASSET_UPLOADED";

  4. Configure the data you want to add to the plots. You can even add data from Shapefiles that you have uploaded to GEE, see lines 9 to 16

  5. Run the code. and then execute the task on the top-right frame "Tasks". This will generate a CSV that will be stored in your Google Drive, you can download it from there!

alt text

Hope this explanation was easy to understand!

permanent link

answered 28 Mar '23, 14:26

Open%20Foris's gravatar image

Open Foris ♦♦
9995714
accept rate: 10%

edited 28 Mar '23, 14:33

Thank you very much for the quick and clear reply!that's very useful.

(28 Mar '23, 14:30) nephentes7 nephentes7's gravatar image
Your answer
toggle preview

Follow this question

By Email:

Once you sign in you will be able to subscribe for any updates here

By RSS:

Answers

Answers and Comments

Markdown Basics

  • *italic* or _italic_
  • **bold** or __bold__
  • link:[text](http://url.com/ "title")
  • image?![alt text](/path/img.jpg "title")
  • numbered list: 1. Foo 2. Bar
  • to add a line break simply add two spaces to where you would like the new line to be.
  • basic HTML tags are also supported

Question tags:

×281

question asked: 28 Mar '23, 11:32

question was seen: 561 times

last updated: 28 Mar '23, 14:33