So I am trying to create a custom project to survey tree cover in Myanmar. The version of Collect Earth that I downloaded is the "drylands demo" and appears to only include the US, Canada and Mexico.

I need to overlay a grid for my study area in Myanmar. I found this answered question from 2015, but I am wondering if there is a better/newer way to go about this? https://openforis.support/questions/71/creating-a-custom-project

Any help is appreciated, I am totally new to this and not sure exactly what to do. Thank you!

asked 25 Nov '17, 16:09

ashley4314's gravatar image

ashley4314
11136
accept rate: 0%

edited 25 Nov '17, 23:45

Stefano%20%28OF%29's gravatar image

Stefano (OF) ♦♦
4.8k119


12next »

Hi Ashley,

You could try this answer

Basically, use the simple IPCC survey proposed in that post and also the link from Google Earth Engine link to generate the grid over Myanmar. You load the survey on Collect Earth and then you go to Tools->Properties to load the CSV file with the plot locations generated in Google Earth Engine (you need to register as beta tester in order to use GEE )

/Support

permanent link

answered 27 Nov '17, 17:34

Open%20Foris's gravatar image

Open Foris ♦♦
1.0k5714
accept rate: 10%

Thank you for the suggestion! Is there some sort of tutorial for GEE?

I'm not seeing the Run function or anything they mention in the answer you linked, except for the polygon drawing which I assume is what I use to create the grid?

(27 Nov '17, 18:41) ashley4314 ashley4314's gravatar image

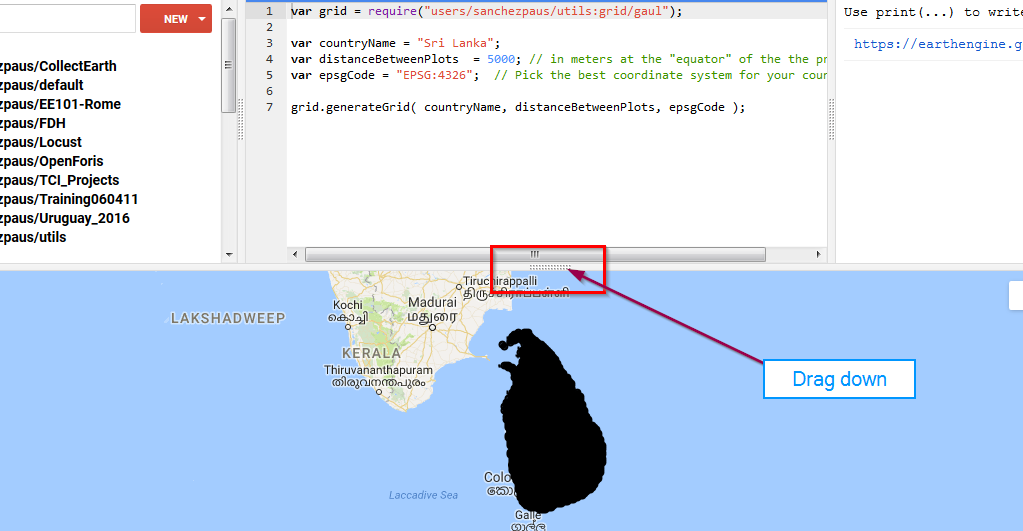
Yoalt textu need to drag down the top bar in order to see the code and the run button:
permanent link

answered 27 Nov '17, 23:44

Open%20Foris's gravatar image

Open Foris ♦♦
1.0k5714
accept rate: 10%

Okay this makes more sense now, thank you! How would i determine what to change the distance between plots to? My only country of interest is Myanmar.

permanent link

answered 03 Dec '17, 22:20

ashley4314's gravatar image

ashley4314
11136
accept rate: 0%

So sample size calculation is a bit more tricky.

There are two things you need to consider:

  1. Technical : What is the level of accuracy you want to achieve. Specifically for what variable you are collecting. Different variables will have different uncertainties in the data collected as the uncertainty is measured through the number of times the value appears in the study. Normally you will achieve higher accuracy in the "main" classes like the IPCC Land Use Category (Forest, Settlement, Cropland...) than in the sudvisions (type of forest, type of cropland, type of grasslands...). So if you need a high accuracy on data of Land Use Change, you will need to collect a lot more plots that if you just want to have a high level of accuracy on the IPCC classes for the current Land Use.
  2. Practical : how much time you have for the data collection activity. Depending on the level of complexity of the survey, the internet speed and the knowledge of the area you should be able to collect between 100 (slow internet, difficult survey) to 300 (fast internet, simplified survey) plots per day. How many days and how many people will be collecting data? Also, are there a lot of Google Earth very high resolution images in the AOI or will you need to use Landsat or Sentinel for assessing the plots (this takes longer) This will make the decision easier. Obviously, at the end you will get a certain amount of plots and from that you will be able to calculate the uncertainties.

So there are two approaches to try to accomodate these aspects :

  1. Building a multiple grid so that the data collection can start from plots at say 10x10 km and then if the uncertainties is too large, refine it with a grid one level down, in this case 5x5 km. This grid has 4 times as many plots than the initial one. Since you already collected the plots at 10x10km (say 100 plots) then it means that you will have to collect the remaining ones (in this example 300). If this data is still not accurate enough then you move to a 2.5x2.5 km grid and so on...

  2. The previous approach can be a bit complex to set up. A very similar approach which is much easier to design and has identical results is to just use a random sampling design. In this case you will collect data in completely random plots. Once you have collected enough plots you may evaluate the uncertainties. If you are happy with that, you are done! If not, then you need to keep collecting data. To generate a random sampling design you can use this Google Earth Engine Script : IMPROVED GRID GENERATOR

permanent link

answered 05 Dec '17, 16:31

Open%20Foris's gravatar image

Open Foris ♦♦
1.0k5714
accept rate: 10%

edited 06 Dec '17, 15:13

Thank you again for all the helpful information!

So this time I was able to generate a random grid of 1000m x 100 as a test, however when I went to Run it to get a CSV table it failed. After 16 seconds the error message reads "Error: Error in map(ID=0_0001889cb5f78ad69ad2): Feature.select: Selected a different number of properties (11) than names (12)."

I am unsure of what this means, am I doing something wrong?

(11 Dec '17, 17:44) ashley4314 ashley4314's gravatar image

Hi Ashley,

The script seems to be running fine...can you try again? This is the latest version https://code.earthengine.google.com/c4a9f26e3b2242fca5571750531da1cc

/Regards

permanent link

answered 11 Dec '17, 21:25

collectearth's gravatar image

collectearth ♦
1.0k16
accept rate: 17%

I tried again, still an error, this time after 2 minutes. Maybe I am doing something wrong? I input the same values (1000m and 100 plots) and click Generate Grids, then there are two items under the Tasks tab in the top section, on the far right. I clicked Run next to "Myanmar random 100". I also tried to Run the "Myanmar syst 100" and that one failed almost immediately.

(16 Dec '17, 16:13) ashley4314 ashley4314's gravatar image

Hi Ashley,

You are right, there is a problem with the script. If you choose a distance of 1000 meters the script fails due to an "out of memory" exception. For Myanmar (676,578 km²), a grid of 1000 meters means 676,578 plots... that is a bit too much for Google Earth Engine to handle (this grid generation script is not really what Google Earth Engine is made to do)

The random grid generation seems to be working well though, did you try that? I just generated a 10.000 plots grid using the script and it seems fine : here the link in case you want to download it.

Do you really need a 1.000 meters grid for all of Myanmar? Do you have a predefined study area? If you do I might be able to help you to generate the grid for just that area avoiding the "out-of-memory" issues.

permanent link

answered 17 Dec '17, 09:41

collectearth's gravatar image

collectearth ♦
1.0k16
accept rate: 17%

I have modified the script so that now you can choose a province or district within the country. This should speed up the dense grid generation a lot! Check it:

https://code.earthengine.google.com/c4a9f26e3b2242fca5571750531da1cc

permanent link

answered 18 Dec '17, 01:40

collectearth's gravatar image

collectearth ♦
1.0k16
accept rate: 17%

Thank you so much! You are right, that was a very large number of plots for GEE to generate; my study area is Rakhine state so it is a lot better for me to focus on this one area. Unfortunately, the script is still failing even when I select Myanmar, then Rakhine state, and set the grid to 2000m x 50 plots.

I really appreciate all of your help with this!

(20 Dec '17, 01:22) ashley4314 ashley4314's gravatar image

Hi again, fixed the issues, please test again!

If you find another problem here is the output I generated :

50 random

2000 m systematic

permanent link

answered 20 Dec '17, 10:52

Open%20Foris's gravatar image

Open Foris ♦♦
1.0k5714
accept rate: 10%

Thank you so much! Could you also do one for Taninthayi region, Myeik province? I just tried and this one failed, with the same distance and number of plots.

(21 Dec '17, 01:23) ashley4314 ashley4314's gravatar image

Hi Ashley,

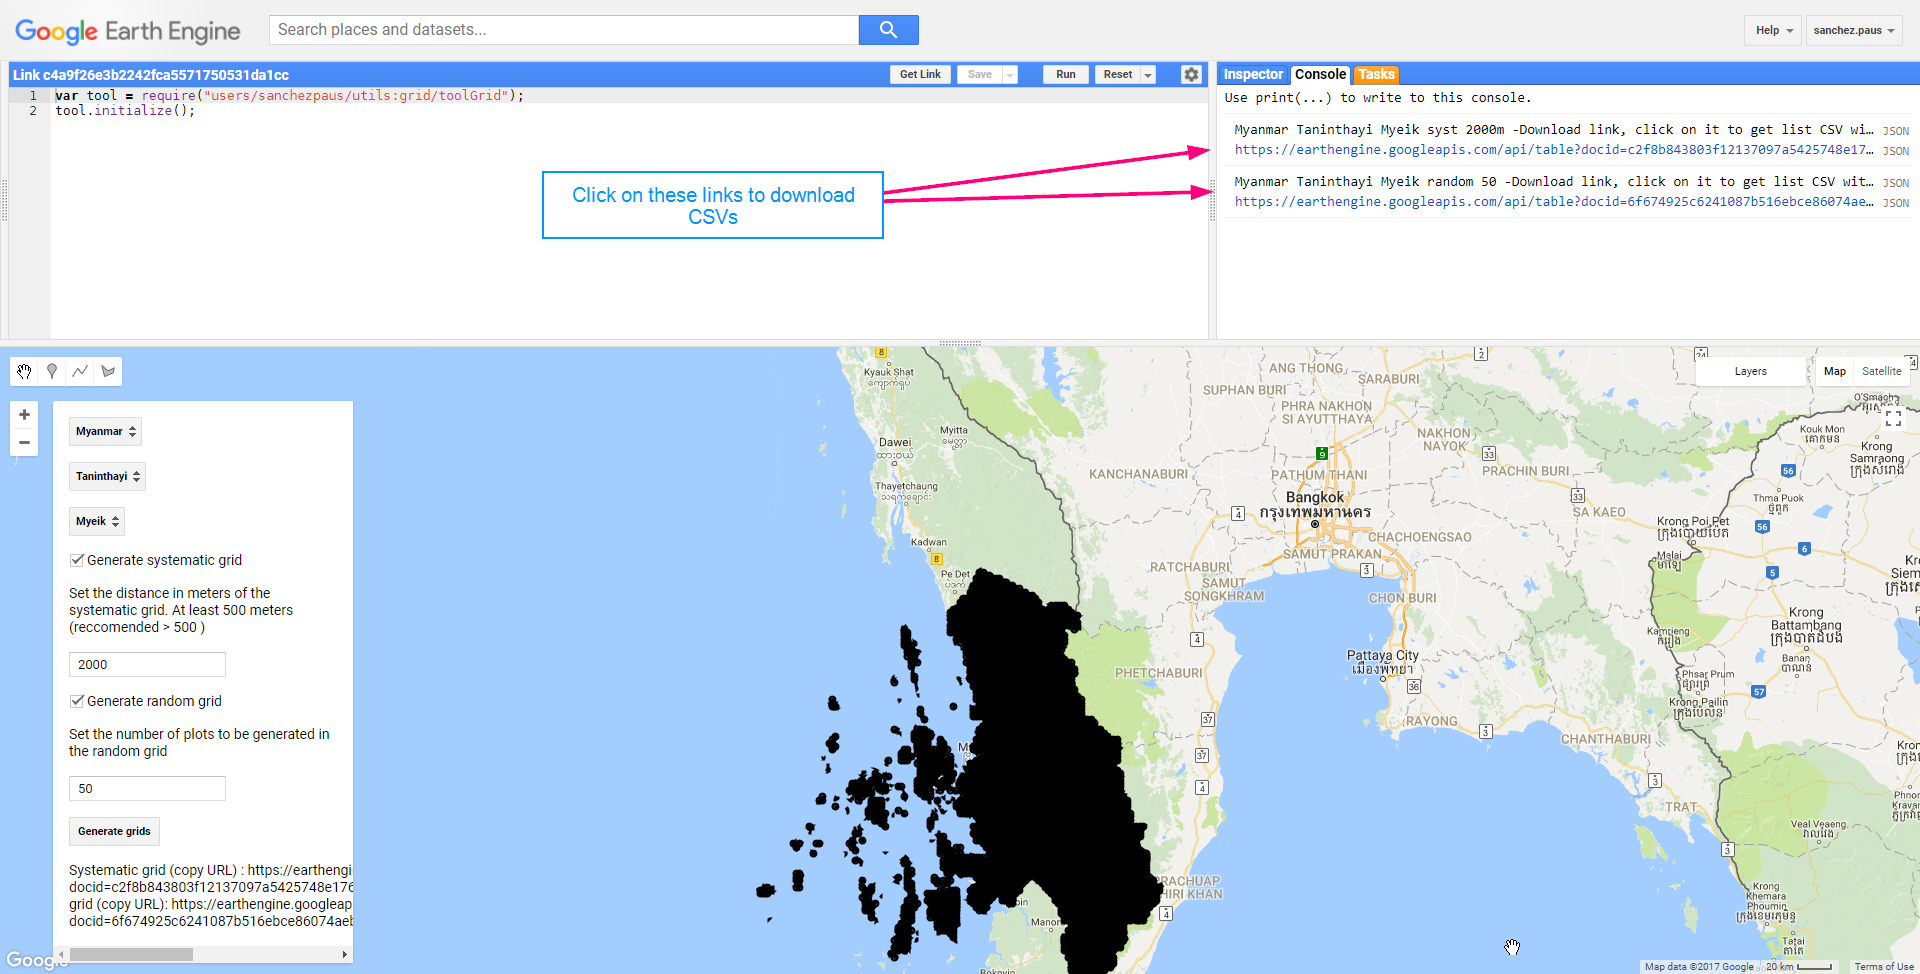
Please check again that it is working. You need to click on the links in the console!

alt text

permanent link

answered 21 Dec '17, 11:55

Open%20Foris's gravatar image

Open Foris ♦♦
1.0k5714
accept rate: 10%

The file saves successfully when I use this link, but when I go to Downloads to open the file it just displays as "file" and cannot be opened in Excel. Previously, I have been able to open CSV files in Excel, and they display as CSV file on my computer, not just "File". Do I need to update my software or something? Sorry I am not very savvy

(21 Dec '17, 13:54) ashley4314 ashley4314's gravatar image

Hi there, just letting you know that I am still stuck with the previous issue from Dec 21 (saving the CSV files so they can be opened in Excel to "clean" the data for Collect Earth). Any assistance with this would be much appreciated!

(03 Jan '18, 15:51) ashley4314 ashley4314's gravatar image

Excel is not the best software when it comes to CSV as it is not "smart" enough. In order to open a CSV file properly you have to define the character used as separator. By default Excel tries to use the semicolon (;) character while the CSV files generated by GEE have a comma as column separator.

You can try to open the file this way instead: LINK (use commas!! )

Or even better you can install LibreOffice which has a much better CSV handling capacity.

Regards and happy new year!

permanent link

answered 04 Jan '18, 11:53

Open%20Foris's gravatar image

Open Foris ♦♦
1.0k5714
accept rate: 10%

Thank you! So I am now finally able to clean the CSV file. I left only the first 3 columns (for my file it says earthID, latitude, longitude). When I try to load it into Collect Earth there is an error. Then I realized the "earthID" column is blank.

I am sure something was wrong so I went back to this question since it had been awhile (https://openforis.support/questions/1444/creating-sampling-grid-for-collect-earth?page=1&focusedAnswerId=1445#1445).

I see that their CSV file has just id for the first column, with 6-digit values. What do these ID numbers mean, and why are mine blank?

(04 Jan '18, 19:00) ashley4314 ashley4314's gravatar image
Your answer
toggle preview

Follow this question

By Email:

Once you sign in you will be able to subscribe for any updates here

By RSS:

Answers

Answers and Comments

Markdown Basics

  • *italic* or _italic_
  • **bold** or __bold__
  • link:[text](http://url.com/ "title")
  • image?![alt text](/path/img.jpg "title")
  • numbered list: 1. Foo 2. Bar
  • to add a line break simply add two spaces to where you would like the new line to be.
  • basic HTML tags are also supported

Question tags:

×494
×284

question asked: 25 Nov '17, 16:09

question was seen: 11,688 times

last updated: 05 Jan '18, 17:53