|
So, I have been working awhile now to create a custom project/survey in Collect Earth focusing on a region in Myanmar (Taninthayi, Myeik province). I am using this software (link below) to generate a CSV file containing lat/lon values to create a sampling grid. My eventual aim is to analyze tree cover in this region of Myanmar. https://code.earthengine.google.com/c4a9f26e3b2242fca5571750531da1cc My version of Collect Earth is set up with the default Drylands Demo. I am fairly certain that I need to create my own .ced file using Collect for my project; I only need id, latitude, and longitude (not slope, elevation, etc). Then once the .ced file is created, I would simply open it in the Collect Earth program and add the CSV file with the sampling coordinates (Tools -> Properties, etc). My question is, HOW do I create this .ced file in Collect? Do I set this up in my web browser or do I need to use downloadable Collect software, separate from Collect Earth? I was looking at this other user's question (link below); the last answer provided includes two screenshots of Collect Designer that I believe I should be using. How do I access it? https://openforis.support/questions/71/creating-a-custom-project |
|
Dear Ashley, The Collect Earth Project files (.cep) that contains all the necessary information to set-up a survey (data structure + grid/sampling design) are created with an application called Open Foris Collect ( a bit confusing I know) ... Within this tool there is a section called Survey Designer. There you can create your survey. You can start by cloning the drylands survey (download the CEP here ). Please follow these videos (the User Interface of Collect has been updated since I made the videos but the functionality is the same):
Please try to follow these videos and let me know if you need more help. CE Support Thank you for sharing those videos! They have definitely cleared some things up for me. My main issue right now is editing the grids I generated with the Earth Engine code so that I am only retaining those grids/plots surrounding my relatively small study area. From the videos I can see how to label points as forest, river, etc but I can't tell if there is a way to specifically select for some plots and delete the others, in order to focus my survey (and also to free up space, as Google Earth is currently reading a huge file). I will try to post some screenshots so you can see what I mean. This is the area I am focusing on. The purple polygon outlines a protected area (file from a colleague, its a .kmz I imported). I am most interested in the points around this purple area and within the white rectangular shapes (fishing grounds of various communities). This image shows how many "extra" plots/grids there are within the file generated by GEE. I can't just remove these values from the .CSV file since I don't know what to remove without being in Google Earth Pro and seeing the plots. |
|
Dear Ashley, Sorry for the late reply, I hope it is still useful! In order to produce plots for a specific area you need to do one of these things:
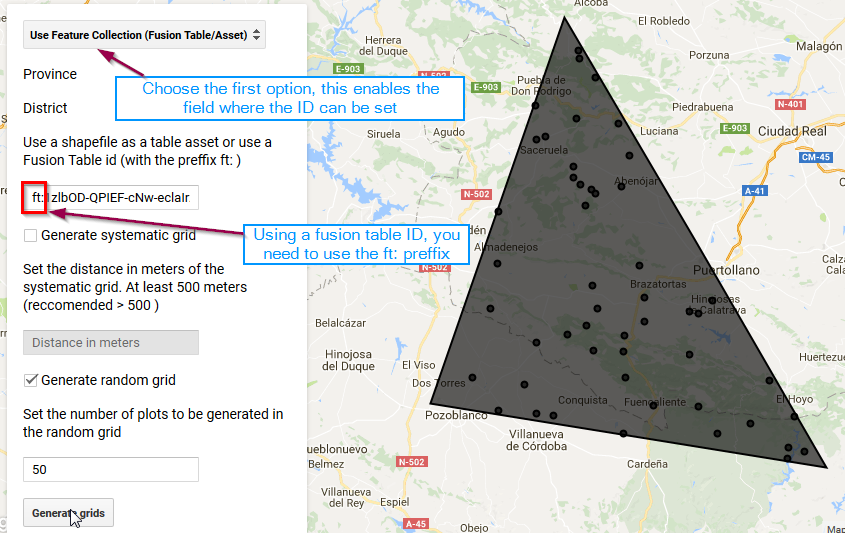
Once you have uploaded the shapefile/KML file with your Area of Interest you can use the updated version of the plot generation script that allows you to use a Fusion Table(KML) or Table Asset Id. HERE IS THE LINK TO THE PLOT GENERATION SCRIPT In this new version you can choose (in the first option where you pick the country ) the option "Use Feature Collection (Fusion Table/Asset Id)" then you can set the table-asset id or the Fusion table ID, using the "ft:" prefix.
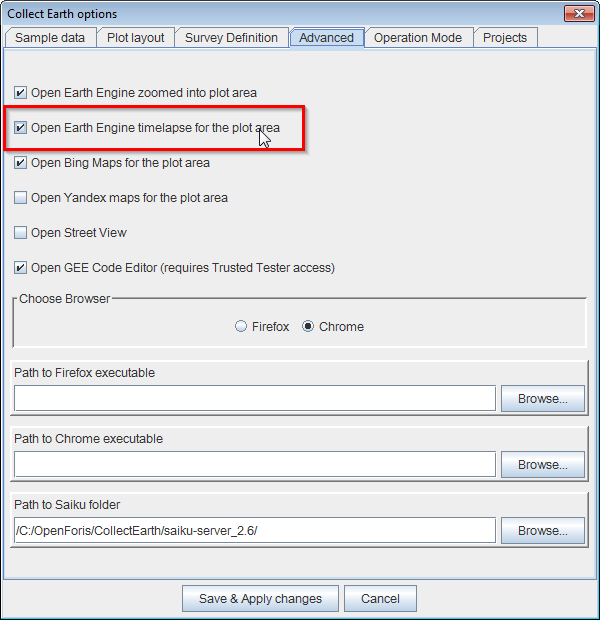
Your reply is very useful, thank you! This is an ongoing project that is part of a larger report so definitely not too late. Once I make the shapefile I want to overlay the grids onto the same study area in this program (called Timelapse, it uses Google Earth Engine). That way I can see the changes in forest cover over time. https://earthengine.google.com/timelapse/ Is this possible, and how would I go about doing this using Collect? Thanks again! |
|
Dear Ashley, In the asset id you need to include the full path to the asset (if you uploaded the shapefile to a Google Earth Engine asset) or the ID (not the name) of the fusion table.
Hope this clarifies the issue! Thank you! It worked this time, using "users/ashley4314/crab-communities_shp" as the asset ID for the shapefile. The resulting grids display just fine on-screen. However, when I click on the download link under Console, I get an error message on a new screen "Internal Earth Engine Error" for both the Random and Systematic grids. I have it set to 1500 meters and 50 grids. Am I missing something here? |